How to Conduct Big Data Analysis Using
Google Trends
By David S. Krause, Marquette
University, Associate Professor of Finance
February 2022
A Powerful, Free Data Analysis Tool. Google Trends, a
data analysis tool provided by Alphabet, is being used by student investment
research analysts in Marquette’s Applied Investment Management (AIM) program. This
is a valuable resource for discovering current trends and keep track of what
people are talking about – or better yet, what they are searching. If an
analysis is researching a potential product or service, Google Trends can help learn
what people are most likely to prefer. The Trends tool shows what people around
the world are searching on Google. Trends. For example, if a student is
researching a new product offering, Google Trends can show by region if people
are searching for the product.
While students can utilize Python and R programming to
finetune the research process, the good thing about this tool is that anyone
can use it. Google Trends is free and does not involve any complicated forms or
requests. All the analyst has to do is type in a search query and click
"Go" which is then followed by a time series graph. This display is
associated by date with how often a certain term or phrase was searched for on
the Internet using Google. The graph also has the option to change the metric
and view data for any specific time period or geographic area. This makes is
possible to see how many searches there have been in a specific region or country.
The ability to customize the time parameters is useful to understand past
trends relative to current searches.
Students know that some social media data scrapping can be misleading
and inaccurate; however, Google is a reliable source for search trends. It can
be used to search for investment ideas, advice from industry experts, and support
for management or analysts’ projections. They also can explore the top keywords
analysts on the Street are using in their reports in order to better understand
their thinking. By studying what others are searching, this helps students researching
learn from others and make better investment decisions.
What is trending and is demand for a firm's product
meeting expectations? A Google Trend analysis allows an investment researcher
to analyze trends by firm, product category, style, or region. Trends are
identified by tracking search volume over time; the more search traffic
generally means interest in the topic is trending up. For investing purposes, AIM
research analysts who follow international stocks use it to track interest over
time by region. This can help them identify investing consumer and other economic
trends by region. For example, some regions may be experiencing a housing slowdown,
while others may be experiencing a housing bubble. If an analyst is interested
in investing in an international residential real estate or housing stock, it
is important to be aware of regional trends. While there may be housing bubbles
in different regions, a researcher wants to use a Google Trend analysis by country
to help identify regions that are more likely to be affected by a housing bubble.
Why Google? This is as of 2021, Google is the most
visited website in the world with over 70 billion visits per year. It also dominates
the search engine market with more than 90% of all searches. Want more? Google
processes more than 4 billion searches per day or nearly 50,000 search queries per
second. Finally, most people are dependent on Google and use it on average four
times per day or PCs and smartphones.
How to use Google Trends? This tool can help search
for trends by category, compare how different topics compare over time, and see
how much interest in a topic has increased or decreased over time. How would
you understand the potential demand for electric scooters by regions?
Let's begin. The first step is search on the term “electric
scooter” in Google Trends: https://trends.google.com/trends/explore?date=today%205-y&q=electric%20scooter.
The search was conducted worldwide for the past five-year time period.
Electric scooter (Interest
over time)

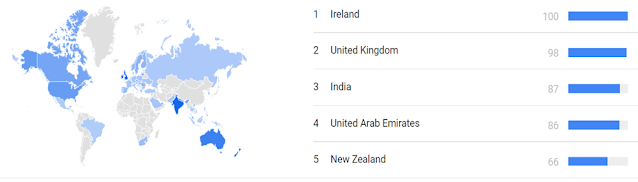
Then it is possible to analyze the interest by region and
country.
Electric scooter (Interest
by region)
It is possible to analyze the interest by city.
Electric scooter (Interest
by city)

Then it is also possible to analyze the term by related
topics.
Electric scooter (Interest
by related topics)

It is also possible to analyze the term by related searches.
Electric scooter (Interest
by related topics)

There is the ability to go much deeper into the advanced
search options for Google Trends to find key statistics, phrases, and keywords
for a specific country. For example, if a researcher was interested in statistics
in the United States, and specifically by state or city, they can look at more
granular data. In this case, we looked at California and conducted a similar
analysis as shown above.
Electric scooter (Interest
by state: California)