Sunday, May 14, 2017

A current AIM Fund holding: Nidec Corp. (NJDCY) by Matthew Holldand. “Nidec - An Intriguing Opportunity Ready for 2018”

Nidec Corporation (NJDCY, $23.45): “Nidec Keeps Motoring Along”
By: Matthew Holland, AIM Student at Marquette University

Disclosure: The AIM Equity Fund currently holds this position. This article was written by myself, and it expresses my own opinions. I am not receiving compensation for it and I have no business relationship with any company whose stock is mentioned in this article.

Nidec Corporation (NYSE: NJDCY) develops, manufactures, and markets electric motors and related components and equipment.  NJDCY have customers across the globe, with the majority of customers based in the Asia Pacific and the United States.

• NJDCY’s business portfolio transformation increases diversity and growth opportunities.

• NJDCY could see margin improvement with new initiatives.

• Global solar energy trends show promising growth capabilities for NJDCY.

• Share repurchase plan could lead to price increases.

Key points: With SSD’s emerging as an alternative to HDD’s, NJDCY has decided to expand its portfolio.  This updated portfolio will shift from an IT focus to the automotive, appliance, commercial, and industrial markets.  This will provide a diversification benefit against the IT market.  Furthermore, it allows NJDCY to expand through high efficiency and motor drive systems.

Nidec Corporation has maintained rather steady margins the past few years.  New initiatives by management could soon change that, with goals of increasing gross margin to 31% and operating margin to 15% by fiscal year 2021.  This effort will be led by increasing automation and decreasing the current workforce by nearly 50%.  Additionally, internal manufacturing is expected to decrease direct materials costs.

NJDCY currently offers motors and control electronics utilized in the photovoltaic power generation system.  Solar capacities reached nearly 230 GW in 2015, and these capacities are expected to increase.  China, Japan, and the United States represent the three largest markets in solar energy.  Conveniently, these three nations account for nearly 64.1% of NJDCY’s revenues, representing strong growth capabilities.

NJDCY currently utilizes a share repurchase program.  Repurchasing shares below their accounting book value can help drive price increases in the near future.

What has the stock done lately?
Since NJDCY’s release of fourth quarter earnings, NJDCY’s stock is up roughly 2.17% in barely two weeks.  NJDCY’s stock is up 8.46% year to date.  With promising growth opportunities on the horizon, NJDCY’s stock may continue to trend upwards.

Past Year Performance: NJDCY has increased by 24.40% over the past year.  Much of this increase was driven by a strong stretch in July 2016 in which the price increased by 5.29% leading up to the release of first quarter earnings.  This strong streak can primarily be credited to a solid fiscal year 2015 and optimism for a strong first quarter.

Source: FactSet

My Takeaway

NJDCY remains an intriguing option considering strong past performance and future capabilities.  While NJDCY’s margin goals may be difficult to match in a short period of time, their efforts seem likely to improve margins at the very least.  Furthermore, their growth opportunities in solar energy and their expanding portfolio provide optimism for improved success.  Coupled with NJDCY’s share repurchase plan, these events provide a positive outlook for NJDCY going forward.


Saturday, May 13, 2017

A current AIM Fund holding: Franklin Electric (FELE) by Stephen Arcuri. “FELE has Primed the Pump - Ready for Infrastructure Spending”


Franklin Electric (FELE, $37.40): “Franklin Electric has Primed the Pump”
By: Stephen Arcuri, AIM Student at Marquette University


Disclosure: The AIM Equity Fund currently holds this position. This article was written by myself, and it expresses my own opinions. I am not receiving compensation for it and I have no business relationship with any company whose stock is mentioned in this article.

 Summary

Franklin Electric (NASDAQ:FELE) is an international developer, manufacturer, and distributor of pumps that move groundwater, wastewater, and fuel. FELE operates in three segments, Water Systems (80% of revenue) and Fueling Systems (20% of revenue), and an “other” segment which is used to house corporate and administrative costs.

• FELE recently announced a series of acquisitions to establish the new Headwater Companies entity, a new distribution segment that will report separately. The purchase of Western Hydro Holding Corporation, and California and Drillers Service, Inc. and 2M Company Inc. are all set to close by the end of 2Q 2017.

• FELE is set to recognize gains from a more favorable product mix as Fueling Systems (9% organic growth) takes up a larger share of revenue compared to Water Systems (-1% organic growth).

Key points: Investors were disappointed in late April by Franklin Electric’s earnings miss, as both Water Systems and Fueling Systems saw operating margins fell to 13.0% and 20.7% respectively. This along with a weaker than expected first quarter sales and higher than expected acquisition costs seems to have caused many investors to think Franklin Electric has run dry.

Franklin Electric’s shocking strategy will soon jump start its shares again. Domestically, Franklin Electric looks to cut costs by vertically integrating and starting a distribution segment. This move will improve Franklin Electric’s footprint and service capabilities, with 60 new locations and 500 new employees. The new segment is expected to bring additional annual sales of $275 million and have an operating margin from 4-6%, bringing management’s 2017 estimate to between $1.77 and $1.87.

Only 30% of emerging markets currently utilize pressure pumping technology, an industry standard in the developed world. Franklin Electric’s diverse revenue stream, only 46% of revenues come from the United States, is positioned to capitalize on international organic growth. Fuel revenues saw 11% organic international growth YOY in Q1. Improving tailwinds, namely stable oil prices, suggest that infrastructure in emerging markets related to gas and oil will continue to increase. A weakening of the dollar relative to the last two years will also present foreign investors with a better buying opportunity for at least the near future.

Market penetration is key for Franklin Electric, as 80% of revenue comes from replacement parts rather than first time sales. Organic growth sales have, and still largely do, represented initial sales rather than revenue from replacement parts. As these markets mature, FELE will be able to further capitalize on their initial success. Until then, the diversification of their business with the new distribution segment will help to generate more consistent revenues.

What has the stock done lately?
Franklin Electric has experienced a 16.42% drop in price since their earnings call on April 28th, 2017. This presents buyers with an excellent opportunity to take a long-term position while Franklin continues to recognize one time transaction costs that drag earnings per share.

Past Year Performance: FELE is down only 3.86% year to date, despite experiencing a drop of 16.42% since April 28th. Year over year, however, Franklin Electric is up 14.79% as they have continued to improve their margins and strategically position themselves both domestically and internationally.

Source: FactSet

My Takeaway

Despite the Q1 earnings miss, Franklin Electric has a strong long term outlook as they expand internationally and vertically integrate domestically. Short term profitability will likely be hurt as the synergies and integration with the distribution segment take time to materialize, but the decrease in stock price represents a buying opportunity to long term investors. 


Friday, May 12, 2017

A current AIM Holding: Dominion Diamond Corporation (DDC) by Andrew Crossman: “A Canadian Diamond in the Rough”


Dominion Diamond Corporation (DDC, $12.78): “This is truly a diamond in the rough”
By: Andrew Crossman, AIM Student at Marquette University


Disclosure: The AIM Equity Fund currently holds this position. This article was written by myself, and it expresses my own opinions. I am not receiving compensation for it and I have no business relationship with any company whose stock is mentioned in this article.

 Summary
Dominion Diamond Corporation. (NYSE:DDC) mines, sorts and markets rough diamonds to a worldwide clientele base. It operates two mines in northwestern Canada.

• DDC’s Ekati diamond mine shift in production from high-value ore to lower-value ore and production shutdowns lead to lower gross margin.

• Management concerns continue as demonetization of India, a sales site of DDC, attributes to a poor economy and lower sales figures.

• Expansion potential leaves management optimistic for the future of development for the Lac de Gras region within the boundary of the Ekati mine.

• Institutional investors increased positions signify a bet on expansion of reserves.

Key points: Dominion Diamond Corp. exercises controlling interest of their Ekati mine. It has been long anticipated that proven reserves of high quality diamonds would expire in 2016. Management has emphasized a switch to lower-quality diamonds and emphasized increased production quantity to mitigate lower gross margins (CY16 7.2% gross margin CY15 25.5%). Additionally, lower margins were partially affected by a jeweler strike in 2016.

India’s federal government announced the demonetization of two bank notes in an attempt to end forgery. One of Dominion’s two sales sites (the other located in Brussels) felt the effect of the subsequent shock to the Indian economy. In their latest earnings call, management stated they were expecting a price drop of 5% to an average price of $55 per carat. The exact effect that demonetization on sales cannot be directly measured as Dominions sales figures were increased in Q4 by the unloading of inventory.

DDC holds ownership of a large area around current mining sites at Ekati and Diavik which they plan to us as expansion to current reserves. Especially at Ekati, management has emphasized extensive testing of 110 known kimberlites (rock type known to potentially contain diamonds) on current mining property. An R&D budget for 2017 of ~$8 million (263% increase over $2.2 million in CY16) is an example of management’s actions to expand current reserves.

As existing mining methods deteriorate, expansion of reserves is crucial to the survival of DDC; institutional investors continue to take positions indicating that they believe Dominion has found the answer (institutional ownership has increased $191.2 million since Q4 FY15). Three long term growth projects promise to increase proven reserves by up to 104.7 million carats. Not on currently mining property, but close enough to take advantage of established transportation, the Jay, Sable, and A-21 pipe could be the driving sources behind future earnings. These projects are currently in early stages of development, and the largest of the three (Jay) could promise 84.4million carats as soon as FY19.

What has the stock done lately?
On March 20 2017, the company was the subject of acquisition from Washington Companies for $13.50 per share. Since March 14, the stock has surged 42.94% although management has not yet accepted the acquisition offer. It has been assumed that this acquisition offer could draw competition from other groups looking to expand their materials portfolio.

Past Year Performance: DDC has increased 14.72% over the past year. The current price of $12.78 represents a discount of 28.4% over accounting book value per share. The market’s concern about decreasing production and performance could explain why the stock is currently trading at a discount to its intrinsic book value. 

Source: FactSet

My Takeaway
Dominion Diamond Corp poor performance detracted from share prices since it was added to the AIM portfolio in November 2013. Poised for a turn around of operations driven by expansion projects, DDC finds itself as a qualified candidate for acquisition as shown by the offer by Washington Companies. Managements hesitation to accept the offer which falls below the book value per share indicates confidence in future performance which will drive stock price ultimately towards a price target of $15.

Currently, the AIM international portfolio is overweight in Canada and despite management’s expectations the stock, this tender acquisition offer could represent an opportunity to exit a position which has underperformed. Rebalancing the portfolio to be more geographically neutral and lowering exposure to macro risks in the Canadian economy.


Source: FactSet


Thursday, May 11, 2017

A current AIM International Fund holding: HSBC Holdings (HSBC) by Cathy Gong. "HSBC shares shouldn't be a part of AIM's future"


HSBC Holdings plc (HSBC, $42.68): Ready for the Summer? HSBC Isn’t!
By: Cathy Gong, AIM Student at Marquette University

Disclosure: The AIM Equity Fund currently holds this position. This article was written by myself, and it expresses my own opinions. I am not receiving compensation for it and I have no business relationship with any company whose stock is mentioned in this article.

 Summary
HSBC Holdings plc. (NYSE:HSBC) is a British multinational banking and financial services holding company that operates in Europe, Asia, North America, North Africa, and the Middle East, and is one of the world’s largest banking and financial services organizations.

• Founded in 1865 to finance trade between Asia and the West in Hong Kong, the firm is headquartered in London. 45.2% of their revenue came from the Asia Pacific region in 2016. The firm operates through five segments and the largest business line is retail banking and wealth management, representing 42.4% of their revenue in 2016.

• Following the sale of operations in Brazil, HSBC completed a $2.5bn share buy-back in 2016, and HSBC continues to exit unprofitable countries. Chief Executive Officer Stuart Gulliver has exited almost 100 businesses in 18 countries.

• Contrary to expectations, the long-term growth rate of HSBC is -18.66%, which means that it lacks reasonably steady earnings. Based on trailing 12 month earnings, HSBC’s P/E is 316.80, while the current market P/E is 17.00. While the mean of the market cash flow per share is $1.67, HSBC’s cash flow per share of $0.62 fails to exceed the market mean.

Key points: HSBC is ripe for removal from the AIM International Equity portfolio. HSBC was added to the International Equity portfolio in October 2015 with a price of $49.94 and a price target of $62.06. HSBC is trading at $42.68 as of 5/5/17. The post full-year results release gave HSBC one of its worst days for share price performance in many years (down 6-7%). It has underperformed 52% of the market in the past 6 months. HSBC has ultimately fallen away from the drivers of its original recommendation and is in a position to be trimmed before the AIM class of 2018 leaves for the summer.

HSBC’s reported income before tax amounted to $7.1bn in 2016, 62% lower than the prior year. 2016 was described as a year of uncertainties created by the significant and largely unexpected economic and political changes, and HSBC’s awful Q4 2016 results showed the impact of Brexit and the turbulent time for this London-based bank. HSBC reported a better than expected Q1 profit on Thursday (5/4/17). Trading revenue jumped 29%, exceeding the average 9% rise at nine of the largest global investment banks. Retail banking and wealth management, HSBC’s largest division, drove the revenue in the first quarter of 2017 by 15% amid rising interest rates.

However, pretax profit for Q1 2017 fell to $5 billion, down from $6.1 billion a year ago. The global slowdown has negatively affected its results. Bad-debt charges in personal finance are subsiding. Asia’s growth is slowing and competition is intensifying. HSBC sold the operations in Brazil as the CEO Gulliver continues to exit unprofitable countries. HSBC’s progress in attracting individual customers in China has been slower than expected according to Reuters. Originally, the company was pitched under the projection of growth in emerging markets. Moving forward, the limited growth potential suggests that HSBC is no longer suitable for the AIM International Equity portfolio.

What has the stock done lately?
HSBC shares jumped by 3.56% as the CEO Gulliver halted revenue decline in the first quarter of 2017, with a current price of $42.68 per share. This recent support for the stock becomes a unique exit point as some of the drivers behind the company’s original admission to the AIM portfolio continue to deteriorate.

Past Year Performance: HSBC has increased 35.32% in value over the past year, but the stock is nonetheless on the bargain table: 2-year CAGR of the stock price is -5.95% and 3-year CAGR is -5.92%. After originally being purchased at a price of $49.94, HSBC proceeded to fall by $7.26.


Source: Source: FactSet

My Takeaway
Despite the 1Q 2017 results showing increased market confidence on HSBC its high capital position to accumulate assets in Asia, stock price decreased by 6.53% since we bought it in October 2014. ROE is down to 0.29%, P/E is 316.80, and long term EPS growth rate is -16.88%. The future growth potential of HSBC is uncertain as Brexit unfolds and a continued slowdown in Asia is likely. Therefore, it is recommended that the AIM International Equity Portfolio sell HSBC.


Dan Fuss of Loomis Sayles is the fixed income equivalent of LeBron James - he's that good!

If LeBron James is the king of basketball - then Dan Fuss is the bond king.

There are several big name fixed income portfolio managers who get plenty of media coverage (i.e. Jeffrey Gundlach, Bill Gross, and Dan Ivascyn); however, Dan Fuss of Loomis Sayles has consistently been one of the best bond fund managers over the long-term. He's a pro's pro. (Note: In the picture below, Mr. Fuss is the one without the basketball).

LeBron James of the Cleveland Cavaliers
Dan Fuss of Loomis Sayles


While I am biased, since Mr. Fuss is a prominent alumnus and supporter of Marquette University's Applied Investment Management (AIM) program, his record speaks for itself. The performance and key statistics (as of 3/31/17) for the Loomis Sayles Bond Fund (ticker: LSBDX) are shown below - and again reveal that he's the top bond fund performer.

Not only is Mr. Fuss one of the world's longest serving fixed income fund managers, but he might be the best. While his 1-year performance is ranked at the top, his 10, 20 and 30-year numbers are also in the top 5 percentile.

Dan Fuss has worked within the investment industry nearly sixty years after earning his BS and MBA from Marquette University. He also served in the US Navy from 1955 to 1958 - and he is currently the vice chairman of Loomis Sayles. (Clicking on the images  below will enlarge them).

Loomis Sayles Bond Fund (LSBDX)


Dan Fuss and David Krause


A current AIM Fund holding: U.S. Concrete (USCR) by Holly Kuffel. “Laying the Foundation for a Solid Hold”


U.S. Concrete, Inc. (USCR, $70.85): “Strong as Concrete”
By: Holly Kuffel, AIM Student at Marquette University

Disclosure: The AIM Equity Fund currently holds this position. This article was written by myself, and it expresses my own opinions. I am not receiving compensation for it and I have no business relationship with any company whose stock is mentioned in this article.

 Summary
U.S. Concrete, Inc. (NASDAQ:USCR) produces and distributes ready-mix concrete, aggregates and other concrete-related products and services primarily to the United States construction industry. The company operates through two segments: Ready-Mixed Concrete (93.3% of total revenue) and Aggregate Products (6.7%).

• The Ready-Mixed Concrete segment formulates, prepares and delivers customer-specific concrete solutions to customers’ job sites in addition to providing on-site services, and the Aggregate Products segment offers crushed stone, gravel and sand for use in commercial, industrial and public works projects.

• Demand is driven primarily by the construction industry (55%-60% of concrete revenue) and the residential housing markets (25%-30%).

• USCR thrives off successful acquisitions and management alludes to several potential acquisition and expansion plans outside of their three largest market positions: New York, California and Texas.

Key points:
U.S. Concrete has secured its position in the AIM Domestic Small Cap portfolio. AIM’s original recommendation from September 2016 consisted of drivers regarding continual growth in market share, rising construction spending and high success with acquisitions. U.S. Concrete remains aligned with these drivers, and with an extremely impressive LTM of price performance, USCR solidified its position as the leading U.S. producer and distributor of ready-mixed concrete. USCR recently exceeded AIM’s initial price target of $66.37, but there are still high expectations for demand in upcoming years.

In April 2017, USCR completed their latest acquisition of New Jersey’s Corbett Aggregates Company and gained access to 401 acres of land and over 35 million tons of aggregate reserves. This acquisition plays a fundamental role in USCR’s strategy for vertical integration and gives a sense of self-sufficiency in the aggregates market, especially where resources like natural sand are quickly depleting. 

As a result of over 17 acquisitions since 2010, USBR has grown over 80% and management anticipates continual growth and profit recognition. As USCR realizes considerable cash flows, they utilize their cash to pay off debts and scout out new investments. In USCR’s 1Q17 earnings report, management alluded to a pipeline of acquisition opportunities in both segments and expansion into new metropolitan areas in order to further vertical integration.

Demand continues to thrive from large construction projects in metropolitan areas, in addition to the growing housing market. USCR is continuing to realize profits from Obama’s highway bill, which extends through 2020. Following Trump’s presidency, the company’s price rose over 40% from acquisitions and demand. Yet, there is high speculation regarding the potential “Trump wall,” in which USCR would be the primary concrete supplier.

What has the stock done lately?
Share prices struggled throughout March 2017 when USCR’s audit committee replaced Grant Thornton with Ernst & Young after recognizing material weaknesses regarding accuracy and completion of tax accounts. Additionally, on March 24, 2017, CFO and Senior VP Jody Tusa, Jr. resigned for personal reasons and is expected to take effect July 1, 2017. This announcement alone resulted in an 8.85% plunge in stock prices. Despite their rocky start to 2017, 

USCR released 1Q17 results on May 4, 2017, resulting in a 14.3% increase in price from $61.90 to $70.75 after exceeding growth expectations and capitalizing on strong demand for concrete. Looking forward, demand for ready-mix concrete is expected to have a strong economic outlook.

Past Year Performance: In the past 12 months, USCR has increased 12.8% from $62.83 to $70.85. Since the initial pitch in September 2016 at a price of $48.34, USCR has experienced significant upward momentum. USCR increased prices by about 6% over the prior year due to strong demand, selling approximately 8.1 million cubic yards of ready-mixed concrete and approximately 5.6 million tons of aggregates. USCR also completed six acquisitions, four of which are concrete producers in New York. Not only did this solidify USCR’s #1 position in the market, but it reflected greatly on their earnings statements during the last four quarters.

1 Year Stock Chart vs. Benchmark
Source: FactSet
My Takeaway
Continual growth and expansion through acquisitions continues to benefit USCR and enhance their large market share. Although the company has reached its 52-week high, it continues to exceed quarterly expectations and take on significant construction projects. USCR has positioned itself well for the continuous rise in demand for concrete and aggregates and will generate healthy cash flows over upcoming years that can be utilized for further investments.

1 Month Stock Chart
Source: FactSet


Wednesday, May 10, 2017

A current AIM holding: AZZ Inc. (AZZ) by Max Mattappillil. “All That AZZ - 2018 Looking Good."


AZZ Inc. (AZZ, $59.05): “A Bright 2018 May Be On The Way”
By: Max Mattappillil, AIM Student at Marquette University


Disclosure: The AIM Equity Fund currently holds this position. This article was written by myself, and it expresses my own opinions. I am not receiving compensation for it and I have no business relationship with any company whose stock is mentioned in this article.

 Summary
AZZ, Inc. (NYSE:AZZ) is a global provider of galvanizing, welding solutions, specialty electrical equipment, and highly engineered services. AZZ provides support to the power generation, transmission, and industrial markets.

• Fiscal 2017 was AZZ’s year as a financial punching bag.

• Acquisitions of PEI Enclose and Alpha Galvanizing have brought AZZ success in addition to their recent decision to retaining Nuclear Logistics.

• 2018 may require sunglasses for AZZ’s shareholders as the year looks to be bright.

Key points: AZZ experienced a very rough fiscal 2017 as their Net Sales, EPS, Gross Margins and Operating Margins all fell while their effective tax rate increased. Low oil patch activity and a rising cost of zinc reduced AZZ’s ability to expand their sales across multiple markets. Management also realized that they may have been a bit aggressive in terms of implementing too many initiatives towards business operations without a reasonable time frame to recognize returns.

However, AZZ could stay somewhat positive as their recent acquisitions of Power Electronics and Alpha Galvanizing have performed very well during fiscal 2017. Combined with AZZ’s fairly recent decision to co-manage Nuclear Logistics with Westinghouse, Azz might just return to being in the black.

AZZ remains obstinate on keeping its corporate staff tight-knit, despite the disadvantages a low-staffed team may bring. To counteract this, AZZ recently added an executive that will focus on operational improvement so that AZZ can smooth its various segments and move forward from the rough patches fiscal 2017 carried.

The petrochemical market has begun to move in favor of AZZ and its new plant for its galvanizing segment is operating with every cylinder firing, boosting AZZ into fiscal 2018. AZZ also secured a contract with Beijing Sino-American Yuli Power Technology to provide 11,500 meters of underground gas insulated line for the new Chinese power project. Establishing global momentum may be the catalyst that pushes AZZ towards a successful fiscal 2018.

What has the stock done lately?
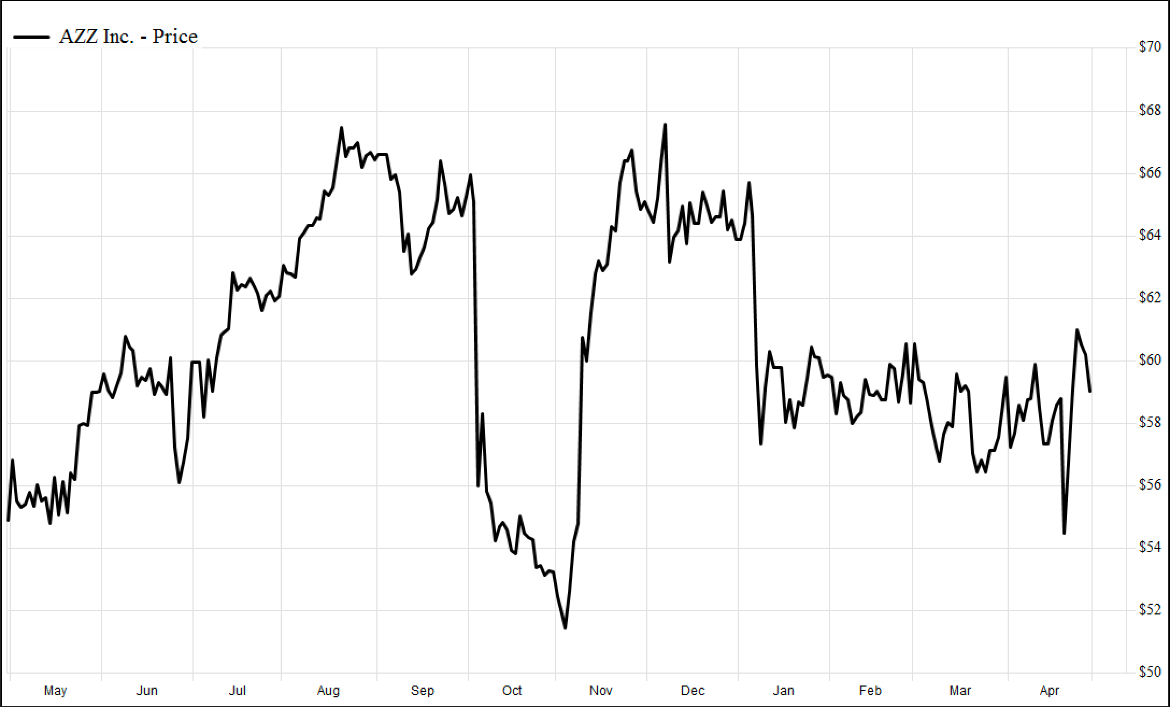
Since AZZ released its earnings on April 20th, 2017, its share value dropped 7.3%. While this drop broke AZZ out of its month long trading range between roughly $57-$60, it spiked up 12.2% over the next five days and recently closed near the top of its previous trading range. While AZZ foresees strong growth for 2018, AZZ is still heavily influenced by the energy market and zinc prices and may return to its previous trading range once again if no significant changes occur.

Past Year Performance: AZZ reached a maximum 1 year share price of $67.67 in September 2016 only to drop down to its lowest 1 year price of $51.60 two months later. Since 2017, AZZ has remained fairly stable and traded in a range between $56 and $60, however it has recently broken out of that range from both the floor and ceiling.

 Source: FactSet


My Takeaway

AZZ had to face significant headwind against its fiscal 2017 operations and currently feels those effects as seen by a reduction in its solar business as well as low oil patch activity. However, AZZ seems to have laid out its groundwork 2018 at a granular level in order to maximize its chances of improving operations. 

AZZ recognizes where they struggled and have taken measures to turn their weaknesses into strengths. An increase in AZZ's acquisition rate and a more global focus on large projects might be the push that lets AZZ put fiscal 2017 firmly behind them.  


A current AIM Fund holding: RSP Permian (RSPP) by William Reckamp. "A Pure-Play Permian Basin Opportunity"

RSP Permian, Inc.  (RSPP, $38.05): Permian’s Production Drives Profits
By: William Reckamp, AIM Student at Marquette University

Disclosure: The AIM Equity Fund currently holds this position. This article was written by myself, and it expresses my own opinions. I am not receiving compensation for it and I have no business relationship with any company whose stock is mentioned in this article.

·         RSP Permian, Inc. (NYSE: RSPP) is a pure-play Permian basin company that focuses on the exploration and production of oil (91% of revenue), natural gas (4%), and natural gas liquids (5%).

·         Commodity price risk increases as WTI drops to April lows due to uncertainty in OPEC’s extended production cuts and the reopening of Libya’s oilfields.

·         In 1Q17 RSPP completed a $2.4 bln transaction resulting in an addition of 41,000 net acres within the Delaware sub-basin.

·         Management has announced an 82%-95% increase in average net daily production for 2017.

·          RSPP Boosted rig count projections from a current 5 rig program to 8 by the end of next year.

Key points: Large influxes in commodity prices create headwinds for all exploration and production companies. It appears as though the oil industry has withstood the declining prices in the last two years by focusing on the most efficient wellheads that extract the highest oil content in their designated acreage. 

Additionally exploration and production companies, specifically RSPP, were able to hedge against these declining prices through cap ex. reduction. Based on CME Group future prices, a barrel of oil is projected at $51.50 in 2021 providing a slight positive outlook.

RSPP acquired Silver Hill Energy Partners LLC along with Silver Hill E&P II LLC for $2.4 bln in order to increase their Permian basin footprint. The acquisition adds another 41,000 net acres to its portfolio resulting in a total net acreage of 97,000. Their net drilling locations should increase by 1,950 with an average lateral length of ~6,300’. 15 MBoe/d are planned to be added to its total daily production of 29 MBoe/d through the Silver Hill merger. 

One of the most promising outlooks for RSPP comes from management’s guidance regarding their daily production increase. With the new acquisition in the Delaware sub-basin average production is estimated to increase between 82%-95% by the end of 2017. Production is projected to increase another 30% in both 2018 and 2019 largely based on the assumption of future inorganic growth within the Delaware sub-basin.

Another driving factor in management’s production outlook results from the additional rig implementations. Currently, RSPP operates on a 5 drilling rig program but has made the intention of increasing this number to 8 by the end of 2017. The number of production wells should increase substantially through with these new rigs thus providing further justification for management’s daily production projections.

What has the stock done lately?

In the month of April RSPP’s share price has been highly correlated with the influxes of WTI’s oil price. On April 10th oil hit a month high of $53.80 while hitting a low on the last week at $48.33. RSPP also jumped to a high on April 10th with a low occurring on April 19th at $37. 

Uncertainty in Syria, especially after the United States launched an airstrike on a Syrian government airfield, steadied oil prices above $50 for the first part of the month. However there is increasing doubt that OPEC will extend its production cuts in addition to the resurgence of production in Libya. RSPP dropped 7% in the month of April from $41.07 to $38.05.

Past Year Performance: Over the course of a year RSPP’s share price has increased nearly 24% from $30.61-38.05. It seems on this longer time horizon oil has not played a large role in RSPP’s price as it has increased only .6% from April 2016. Two main drivers accounted for this stock increase: a 137% jump in total acreage and consistent daily production increases.

 Source: FactSet

My Takeaway

This is one of the stronger pure-play oil companies that continuously focus on factors that can drive production growth. Management has forecasted a production increase of ~80-95% by the end of the year with growth following in 2018 and 2019. The largest risk for oil companies is, of course, oil price uncertainty. With the slide in oil prices from 2014-2016, 

RSPP’s revenue grew 1% in 2015 and 25% in 2016 due to a competitor revenue decrease of 27% and 10% in those respective years. It has withstood commodity headwinds and has made several attempts to bump up future production levels.


 Source: FactSet